


Last year I looked at the park factors for the Reds farm system and did it in one big, long post. It ran for 1700 words and was just a whole lot to take in at once. This year, I am going to give even more information but I am going to break it into several posts.
Today I am going to look at the park factors for the top three levels: Louisville Bats, Pensacola Blue Wahoos and Bakersfield Blaze. The next one will feature the other three teams and then the third part will put it all together.
Louisville Bats
Louisville Slugger Field
Dimensions – 325 feet (LF) – 405 feet (CF) – 340 feet (RF)
Batting Average
Louisville Slugger Field was rather neutral when it came to boosting average to center and right field, but averages on balls hit to left field were higher by 14 points at home than on the road. That is only a 2% boost though which does make it fairly neutral as well. To center and right field averages were boosted by 2 and 3 points, which is less than 1%.
Isolated Power
Louisville Slugger Field hurt players to center field by 9%, but it made up for it by boosting power to both left and right field. To left field, power was boosted by 12% and right field power was boosted by 17%.
Overall Power
Left field didn’t do much for home runs, but it really boosted doubles as there were 14% more doubles hit in Louisville Slugger Field than in road games. Center field boosted doubles by 7% and home runs were only off by 1. The overall difference in isolated power came from half as many triples. Right field is where the difference was really made. Doubles were boosted by 14%, but home runs were boosted by 47%.
Overall Factors
Last season Louisville played as a pitchers park, but in 2013 it played as a hitters park that didn’t boost average much but really gave a boost to power down each line. Perhaps the winds were a little bit different in Louisville this year or the weather just worked out a bit differently in 2013 than in 2012. Louisville Slugger Field has been known to be a slightly pitcher friendly park in the past, but was mostly neutral.
Pensacola Blue Wahoos
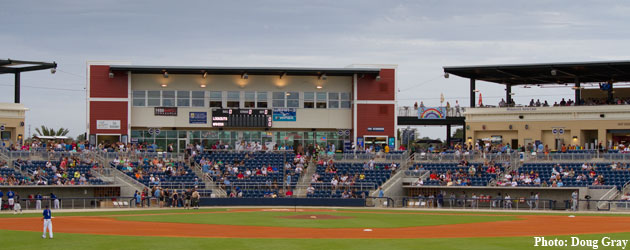
Pensacola Bayfront Stadium
Dimensions – 325 feet (LF) – 400 feet (CF) – 335 feet (RF)
Batting Average
Pensacola Bayfront Stadium boosted average by very small amounts to left field and right field, but to center field there was a decent uptick of an 8% boost on hits to center at home compared to hits on the road. Left field boosted hits by 2% and right field boosted hits by 1%.
Isolated Power
Pensacola Bayfront Stadium really boosted power output to left field, as it boosted isolated power by 45%. To center field there was essentially no difference between home and road output. When players went to right field their isolated power really suffered as it was suppressed by 43%. At home, the isolated power on balls hit to right field was just .178, while on the road balls hit to right field the isolated power was .311.
Overall Power
To left field there wasn’t much of a difference between doubles and triples, with very modest gains at home versus the road. The big difference was in the home run department from left field though, where 69% more home runs hit to left field at home than on the road. In center field there were 3 fewer doubles, 1 more triple and the same number of home runs. Right field suppressed doubles by 14% but what really made the difference was the home runs. Home runs were suppressed by 71%. In Pensacola there were only 9 home runs hit to right field, while on the road there were 31 home runs hit to right field.
Overall Factors
Pensacola Bayfront Stadium sits right on the bay (duh Doug, we can read the name of the stadium!), and last season power was actually boosted to both left and right field, but this year it seems that drastically changed. From personal experience of being at the park, there is a breeze that comes across the stadium that goes across right field and pushes towards left field. That will keep the ball in the stadium to right and push it out a little more towards left as it pushes the ball closer to the line.
Bakersfield Blaze
Sam Lynn Ballpark
Dimensions – 328 feet (LF) – 354 feet (CF) – 328 feet (RF)
Batting Average
Averages at Sam Lynn Ballpark were suppressed small amounts to both left and right field. Left field suppressed average by 1.5% and right field did so by 3%, which is essentially non-existent. To center though Sam Lynn Ballpark boosted averaged by 13%, which is very likely due to the short center field wall resulting in a large boost in home runs, but we will touch on that later.
Isolated Power
Left field suppressed isolated power slightly as it was 4%. Right field boosted isolated power by 6%, which really isn’t much of a difference. However center field saw a big uptick as it boosted isolated power by 46%. At home the isolated power was .375 on balls hit to center field, while on the road it was just .256. The short porch in center really came into play here.
Overall Power
The numbers were rather negligible to both right and left field when it came to isolated power, but right field did serve up 25% more home runs at home compared to the road. The big difference, as alluded to in the batting average section, is the home runs to center. There were 54 home runs to center in Sam Lynn Ballpark and just 28 home runs to center hit on the road. That is 93% more home runs at home than on the road to center.
Overall Factors
Sam Lynn Park really only came into play during the 2013 season when guys hit the ball to center field where it really boosted home runs and thus also boosting the average since those balls had no chance of turning into outs once they cleared the wall at 354 feet. In both right and left field there were small factors at play, but they were mostly negligible for average and overall power.
click here for the entire 2013 park factor series.