

Yonder Alonso came into the 2009 season as the Reds top prospect by just about all accounts (Baseball America, John Sickels, Baseball Prospectus and myself all had him at #1). The Reds started him out in High A Sarasota and he worked his way up to AAA where he played in the playoffs with the Bats. Here is what his season looked like (rehab not included):
| PA | AB | R | H | 2B | 3B | HR | RBI | BB | SO | BA | OBP | SLG | OPS |
| 322 | 280 | 33 | 84 | 24 | 0 | 9 | 52 | 38 | 45 | .300 | .379 | .482 | .861 |
Seasonal Breakdown
The Reds started Alonso off in Sarasota where he struggled in April somewhat with a .227/.302/.453 line including a .227 BABIP. May saw things even out as Alonso hit .362/.439/.543. Alonso was promoted after 2 games in June, but had he qualified he would have finished third in average, second in on-base percentage and he would have led the league in slugging. Alonso only had about two weeks in Carolina before breaking his hamate bone. Alonso missed 2 full months but came back and hit .364/.429/.568 during the 3 weeks he was back. Alonso was finally promoted to the AAA Louisville Bats for the playoffs.
Here is what Yonder Alonso’s season looked like after each game:
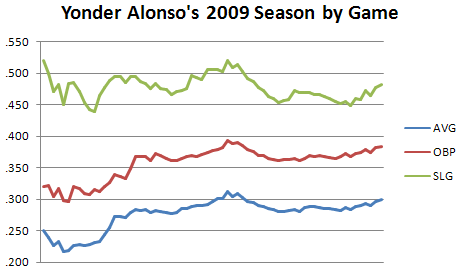
Alonso saw his average go up throughout the season and likewise his on-base percentage also went up with it. The slugging rate went up and down throughout the season. Lets look at how his rate stats went as the season went along.
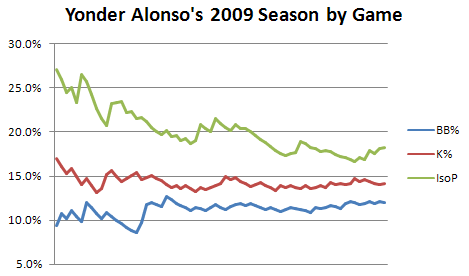
Alonso saw his walk rate rise as the season went along and saw the strikeout rate go down at the start of the year and hover around the 14% rate for most of the season. Alonso did see his power drop as the season went along.
The next thing I wanted to look at was a spray chart for Alonso. Now the bad part is, I still haven’t figured out how to get the data for the lower levels of the minor leagues (the data is formatted much differently for the leagues below AA and I haven’t quite figured out how to write the script to grab it… anyone know perl?). So Alonso’s spray chart is just for his time in AA, the AAA playoffs and the Arizona Fall League. Still, its a decent sample size.
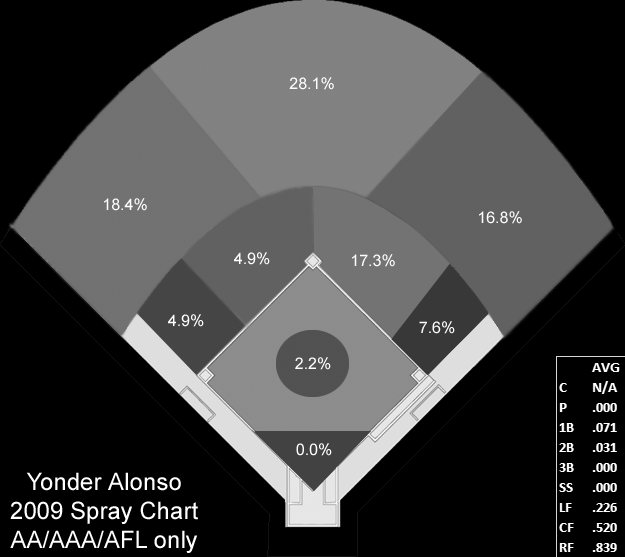
Here is a breakdown of Alonso’s spray charts splits.
| Batting Averages | Spray Charts | |||
| vsLHP | vsRHP | vsLHP | vsRHP | |
| C | N/A | N/A | 0% | 0% |
| P | .000 | .000 | 3.7% | 1.6% |
| 1B | .000 | .091 | 5.6% | 8.5% |
| 2B | .000 | .043 | 16.7% | 17.8% |
| 3B | .000 | .000 | 5.6% | 4.7% |
| SS | .000 | .000 | 1.9% | 6.2% |
| LF | .077 | .333 | 27.8% | 14.7% |
| CF | .571 | .500 | 25.9% | 29.5% |
| RF | .889 | .818 | 16.7% | 17.1% |