


Earlier today we looked at the first data from the Pitch F/X system on Robert Stephenson. This time around we are going to look at two other Top 10 prospects, though we do have some past data on both guys to work with. Lorenzen pitched in the Arizona Fall League last October and had a chance to pitch a few times with Pitch F/X running. Carlos Contreras pitched last spring and in the Futures Game in 2013 with the system running.
Let’s take a look at the raw data:
| Description | Velocity | Movement (in inches) | |||
| Player | Pitch | AVG Velo | Top Velo | Horizontal | Vertical |
| Michael Lorenzen | FB | 95.6 | 97.0 | -7.1 | 9.8 |
| Michael Lorenzen | CH | 86.5 | 87.7 | -5.6 | 10.0 |
| Michael Lorenzen | SL | 85.7 | 86.6 | -1.3 | 1.7 |
| Carlos Contreras | FB | 92.3 | 94.1 | -4.5 | 7.7 |
| Carlos Contreras | CH | 79.1 | 80.7 | -5.0 | 5.2 |
| Carlos Contreras | CV | 76.3 | 80.1 | 0.0 | -5.9 |
Lorenzen’s velocity jumps out at you, averaging nearly 96 MPH on his fastball and topping out at 97 MPH. Let’s look at how the pitches all chart out, as the averages can be a bit misleading in smaller sample sizes:
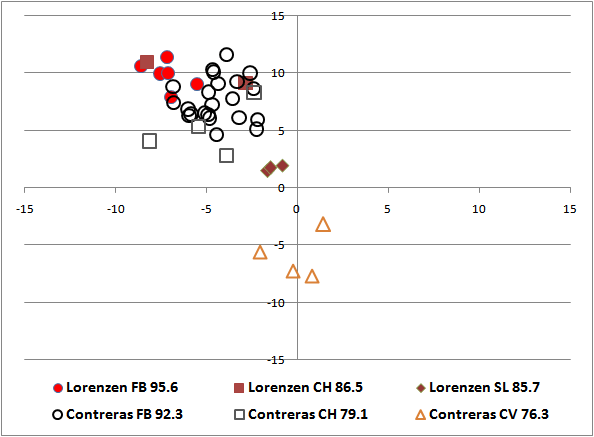
The one thing that jumps out the most is the comparison of the change ups. Contreras shows what you would expect to see from a change up as it has a little more sink and more run than his fastball (well, except that one). Lorenzen is still working on developing his change up, and in limited time with Pitch F/X running last fall his change up looked similar to where it is here. Lorenzen doesn’t seem to be getting that extra sinking action on the two that he did throw and he isn’t getting the typical extra running action either. As noted in this article at Baseball Prospectus (and also mentioned in the article on Stephenson), the spin rate of a baseball is what gives the pitch sinking of rising action. The more spin, the more rise and the less spin, the more sink. We see a big difference in the spin rates between the two pitchers change ups. Of course they have different fastball spin rates, so that is to be expected. But, when we look at the difference between the fastball spin rate and the change up spin rate we can see where Contreras is able to get his extra sinking action from his change up as he had an average spin rate difference of -509 compared to just an average difference from Lorenzen of -352.
Contreras has some cutting action on his fastball, while Lorenzen shows more of a traditional four seamer. They two throw different breaking balls, with Lorenzen throwing a traditional slider, while Contreras throws a curveball. The curveball usually shows a few more inches of movement to the positive side, but the pitch shows plenty of sinking action that does give it a true curveball look that doesn’t have the 2-plane breaking action that some do show.
As noted in the Stephenson article, it is spring training and guys are still working on things and warming up to be full game ready, so all of this information is just more for a fun look-see rather than something to take much away from.