


We looked at how the starters in the Cincinnati Reds system performed when it comes to groundball rates on Monday. Today we take a look at how the relievers in the system perform in the same realm.
As we discussed, groundballs tend to limit scoring, so the more you can generate, the better. What we also discussed was that it’s tougher to generate high groundball rates as well as high strikeout rates because of the different kinds of stuff one needs to be successful in each category, but when you can find someone who is good in both they tend to be very successful.
There were 42 pitchers that threw at least 25.0 innings in 2014 in the Reds system and had at least 51% of their appearances come out of the bullpen. Here is the top 10 groundball rates from this group:
| Name | GB% |
| Conor Krauss | 72.0% |
| Juan Martinez | 65.6% |
| Brian Hunter | 62.8% |
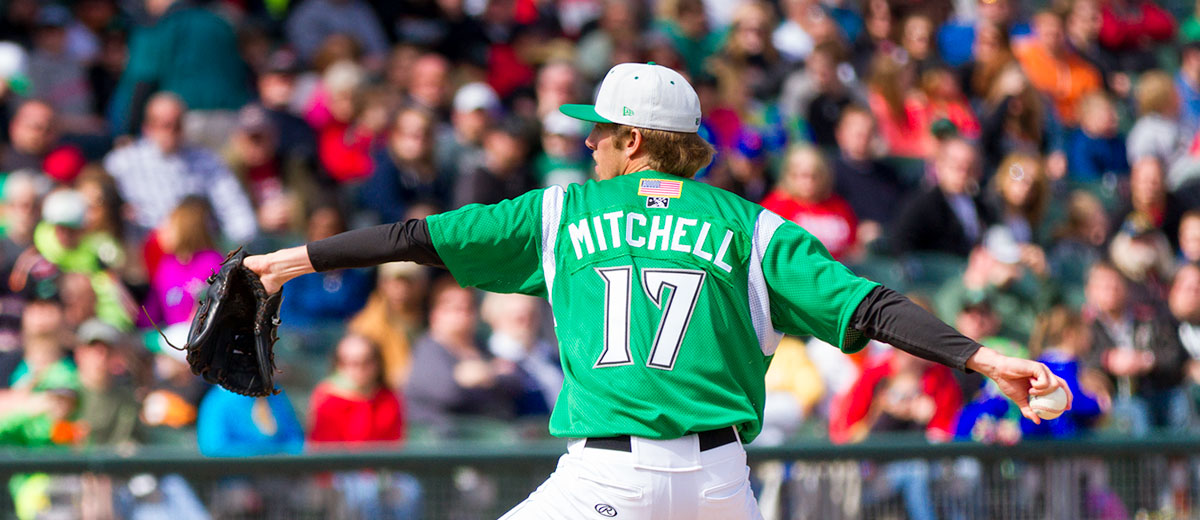
| Evan Mitchell | 62.8% |
| Brennan Bernardino | 57.2% |
| Alejandro Chacin | 57.0% |
| Ty Sterner | 56.9% |
| Nick Howard | 56.3% |
| Jamie Walczak | 54.9% |
| Shane Dyer | 54.8% |
Conor Krauss finding himself above the 70% threshold is impressive. As we discussed with Jacob Constante on the starter side of things, that is rarified air. With relievers, we are working with a much smaller sample size in most cases than we are with the guys that were on the starters list. The larger the sample size, the better, and with smaller sample sizes we can see big swings from year-to-year.
Just like we looked at with the starters, the groundball rates are more of a complimentary thing to a pitchers ability to control his walk and strikeout rates, which are much more driving of their run prevention. Here’s a chart that shows strikeout percentage and groundball percentage plotted against each other.
On the chart you want to be as far to the right as possible and the higher up the chart, the better. The groundball rates aren’t going to make or break a pitcher like a strikeout rate can, but they can help influence their other skills and give that extra little boost to shave a small amount off of an ERA in the long run.
Here’s the entire list for all relievers for their groundball and strikeout rates since the chart is rather crowded (and I can’t figure out how to make the bubbles any smaller on Google Docs – anyone have an idea?).
| Name | K% | GB% |
| Conor Krauss | 22.1% | 72.0% |
| Juan Martinez | 25.2% | 65.6% |
| Brian Hunter | 29.2% | 62.8% |
| Evan Mitchell | 21.2% | 62.8% |
| Brennan Bernardino | 29.0% | 57.2% |
| Alejandro Chacin | 29.9% | 57.0% |
| Ty Sterner | 22.5% | 56.9% |
| Nick Howard | 16.9% | 56.3% |
| Jamie Walczak | 27.2% | 54.9% |
| Shane Dyer | 16.4% | 54.8% |
| Joel Bender | 25.7% | 54.6% |
| Nick Christiani | 9.7% | 54.3% |
| Sean Lucas | 23.3% | 54.2% |
| Ryan Kemp | 19.6% | 53.1% |
| Layne Somsen | 27.4% | 52.4% |
| Soid Marquez | 16.4% | 51.9% |
| Nolan Becker | 28.4% | 51.4% |
| Ryan Dennick | 19.3% | 51.0% |
| Drew Hayes | 24.4% | 50.6% |
| Tony Amezcua | 21.4% | 49.5% |
| Name | K% | GB% |
| Tim Adleman | 21.2% | 49.3% |
| Jefry Sierra | 25.4% | 48.6% |
| Ty Boyles | 27.1% | 48.5% |
| Jacob Johnson | 17.4% | 48.2% |
| Jumbo Diaz | 23.1% | 47.8% |
| Ben Klimesh | 28.7% | 47.0% |
| James Allen | 16.6% | 46.9% |
| Israel Cuevas | 19.6% | 46.2% |
| Seth Varner | 20.1% | 46.0% |
| Jose Williams | 13.4% | 45.8% |
| Fabian Roman | 11.4% | 45.1% |
| Scott Brattvet | 20.2% | 45.1% |
| Zack Weiss | 31.0% | 43.9% |
| Pedro Diaz | 19.3% | 43.5% |
| Jimmy Moran | 21.5% | 42.7% |
| Carlos Gonzalez | 23.3% | 42.6% |
| Bernardo Ramirez | 25.6% | 41.6% |
| Kyle McMyne | 16.9% | 41.3% |
| Pedro Villarreal | 21.0% | 40.0% |
| Wagner Gomez | 24.2% | 39.1% |
| Dan Langfield | 30.2% | 38.6% |
| Chad Rogers | 13.2% | 37.8% |