

John Sickels, of MinorLeagueBall.com has completed his grading of the top 20 (or more) prospects in each system. These rankings are not indicative of John’s actual farm system rankings, which he is currently working on and will soon be found on his website. These are based on a system, as described below.
I went through each system that John graded and took down the grade for both hitters and pitchers. Why did I do that? Well, hitters and pitchers have different values. The value’s that I used were the ones first identified by Victor Wang in an article at The Hardball Times. The guys at Beyond The Box Score took that and made it into a monetary value. Here is what the average prospect was worth who fell in these ranges:
| Top 10 hitting prospects | $32.5M |
| Top 11-25 hitters | $22.3 |
| Top 26-50 hitters | $20.8 |
| Top 51-75 hitters | $12.6 |
| Top 76-100 hitters | $11.1 |
| Top 10 pitching prospects | $13.5 |
| Top 11-25 pitchers | $14.2 |
| Top 26-50 pitchers | $14.2 |
| Top 51-75 pitchers | $10.8 |
| Top 76-100 pitchers | $8.7 |
| Grade B pitchers (as graded by Sickels) | $6.5 |
| Grade B hitters | $4.9 |
| Grade C pitchers 22 or younger | $1.9 |
| Grade C pitchers 23 or older | $1.3 |
| Grade C hitters 22 or younger | $0.62 |
| Grade C hitters 23 or older | $0.45 |
Now I did have to make some adjustments. As we can see, Pitching prospects in the 11-50 range tend to be more valuable than those in the Top 10. Since that doesn’t actually make much sense, I made every pitcher graded as a B+ or better worth the same “average” value of 14.2M.
| Team | A | A- | B+ | B | B- | C+ | |
| H | Value | 32.5 | 22.3 | 20.8 | 12.6 | 4.9 | 0.88 |
| P | Value | 14.2 | 14.2 | 14.2 | 9.8 | 6.5 | 2.6 |
For the C+ guys I had to change a little. I didn’t go through the 292 players who were graded C+ to find the age. So what I did was take the average C grade (split the difference between the two grades). That made 1.6 for pitchers and 0.54 for hitters.I used the weighting for the B grade prospects to wind up with the C+ being worth the same for a C as the B+ was for the B grades. Now that we had the value for each type of prospect, I just ran the numbers for the different teams. One thing to note, I didn’t include the grade C prospects because not all of the C prospects made each list, so the data was left out because it was incomplete. Here are the results:
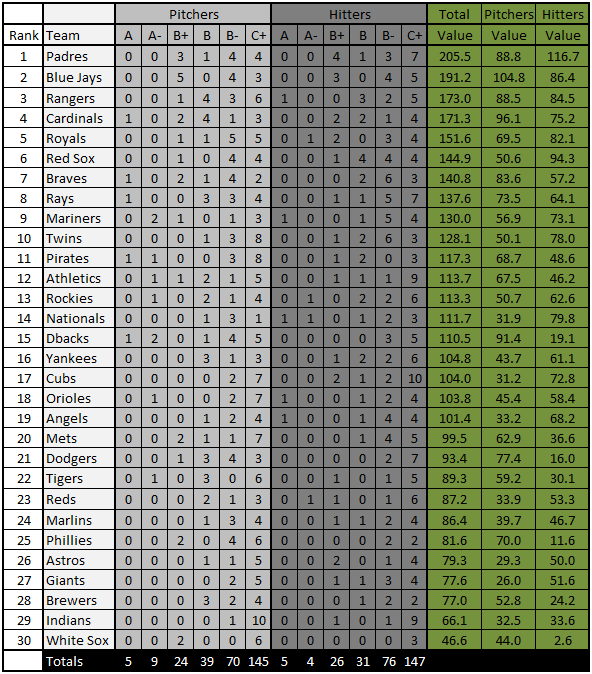
The Reds did not fair so well after after the trades for Sean Marshall and Mat Latos, falling from the Top 10 down to 23rd. Let’s hope it was worth it. I believe it was.
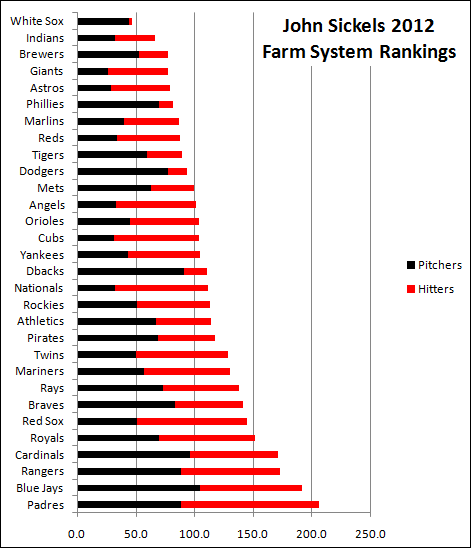
Here is a graphical breakdown of the values for each team with hitters/pitchers values:
I believe that all of the numbers are accurate. If you see an error, let me know.